Light Decoded: How Amateur Astronomers Are Reading the Chemical Signatures of Stars and Nebulae
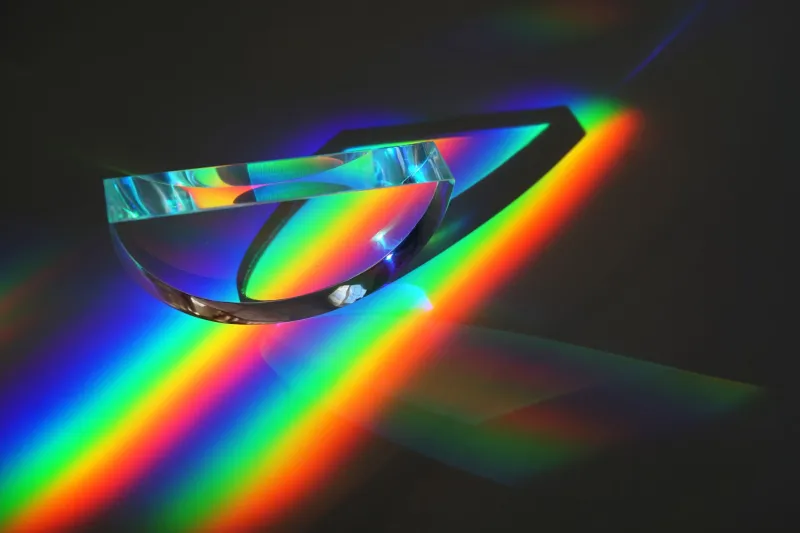
When sunlight passes through a glass prism, it fans into the familiar rainbow of visible color. This is not merely a pretty optical effect. It is a window into atomic physics—a record of which wavelengths of light have been absorbed or emitted by specific chemical elements along the photon's journey. Every star in the night sky broadcasts this same encoded message. The discipline of spectroscopy is, at its core, the science of reading it.
For most of astrophotography's history, spectroscopic observation has been the exclusive domain of professional institutions equipped with spectrographs costing tens of thousands of dollars and mounted on large research telescopes. That boundary has eroded considerably over the past decade. Today, a dedicated amateur astronomer with a modest telescope and a purpose-built diffraction grating can capture stellar spectra of genuine scientific value—and in doing so, cross the threshold from hobbyist to citizen scientist.
What a Spectrum Actually Tells You
When a star's light is dispersed into a spectrum, it does not appear as a clean, unbroken rainbow. Instead, it is crossed by dark lines at specific wavelengths—the absorption lines first catalogued systematically by physicist Joseph von Fraunhofer in the early nineteenth century. These lines correspond to wavelengths of light absorbed by atoms in the star's outer atmosphere. Each element absorbs at a unique set of wavelengths, functioning as a kind of atomic fingerprint.
Hydrogen produces the prominent Balmer series of lines in the visible spectrum. Calcium leaves two strong lines in the violet region. Sodium, iron, magnesium, and dozens of other elements each contribute their own distinctive pattern. By identifying which lines are present and measuring their relative strengths, an astronomer can determine not only what a star is made of, but also its surface temperature, luminosity class, and even its rotational velocity.
Emission nebulae tell a different story. Rather than absorption lines against a continuous background, they produce bright emission lines against a dark continuum—photons emitted as electrons in ionized gas drop to lower energy states. The vivid teal of doubly ionized oxygen at 500.7 nanometers, the red glow of hydrogen-alpha at 656.3 nanometers: these are the spectral signatures that narrowband astrophotographers are already, perhaps unknowingly, isolating with their filters.
Entry-Level Equipment: What You Actually Need
The barrier to beginning spectroscopic work is lower than most people assume. The core component is a spectrograph—or, at the simplest end, a diffraction grating attachment that replaces the eyepiece or sits in front of a camera sensor.
The Star Analyzer 100 (SA100) is widely regarded as the best entry point for newcomers in the United States. It is a transmission diffraction grating with 100 lines per millimeter, designed to thread directly into a standard 1.25-inch filter cell. Priced well under $200, it disperses incoming light into a spectrum that falls onto a camera sensor alongside the zero-order (direct) star image. With a DSLR or dedicated astronomy camera already in your imaging train, capturing a usable spectrum of a bright star requires nothing more than a short exposure.
For more serious work, slitless spectrographs such as the ALPY 600 from Shelyak Instruments offer higher resolution and better wavelength calibration, with resolving power sufficient to separate closely spaced spectral lines and measure Doppler shifts. These instruments, in the $500–$1,500 range, open the door to quantitative work: measuring equivalent widths, classifying stellar types on the MK system, and detecting radial velocity variations in binary star systems.
Your telescope plays a supporting role here. Aperture matters primarily for working on fainter targets—a four-inch refractor is entirely adequate for bright stars down to roughly magnitude six or seven with an SA100. A larger instrument extends the range to fainter objects, including Wolf-Rayet stars, Be stars, and the brightest emission nebulae.
Calibration: The Step That Makes Data Scientific
Raw spectral images are visually compelling, but they become scientifically useful only after wavelength calibration—the process of assigning accurate wavelength values to pixel positions across the spectrum. This is accomplished by identifying known spectral lines within your target's own spectrum, or by comparing against a neon or argon calibration lamp whose emission lines occur at precisely known wavelengths.
Software packages such as RSpec and ISIS (Integrated Spectrographic Innovative Software) are the primary tools used by the North American amateur spectroscopy community. Both allow users to load raw spectral images, define the spectral trace, apply wavelength calibration, and produce publication-ready plots of intensity versus wavelength. RSpec in particular has a reputation for accessibility, with a graphical interface designed to minimize the learning curve for newcomers.
Once calibrated, your spectrum can be compared against reference libraries—the MILES stellar spectral library and the National Institute of Standards and Technology (NIST) atomic line database are both freely accessible online—to identify features and classify your target with confidence.
Contributing to Real Science
The amateur spectroscopy community has established several formal programs through which observer-submitted data feeds directly into professional research pipelines.
The American Association of Variable Star Observers (AAVSO) maintains an active spectroscopy section and a database—the AAVSO Spectroscopic Database—to which members submit calibrated spectra of variable stars, novae, and other targets of interest. When a nova erupts or a Be star undergoes an outburst, professional researchers depend on the global network of amateur observers to provide spectroscopic coverage that no single observatory could maintain continuously.
The Be Star Spectra (BeSS) database, hosted by the Paris Observatory, accepts spectra from amateur contributors worldwide and has grown into one of the most comprehensive archives of Be star behavior available to researchers. Dozens of American amateurs contribute regularly.
The appeal of these programs extends beyond simple data contribution. Participants receive feedback from professional astronomers, develop genuine analytical skills, and engage with the scientific literature in a way that casual observation rarely demands. The telescope becomes a research instrument. The images become data.
Starting Your First Spectroscopic Session
Begin with a bright, well-characterized target. Vega, Arcturus, Capella, and Sirius are all excellent first subjects—each represents a different spectral class and offers easily identifiable features for initial calibration practice. On a clear night with good seeing, a ten-second exposure with an SA100 and a DSLR at ISO 800 will yield a usable spectrum of Vega that clearly shows the Balmer series.
Resist the urge to immediately pursue faint or scientifically exotic targets. The first objective is to complete the full workflow: capture, trace extraction, wavelength calibration, and line identification. That process, performed successfully on a bright star, establishes the procedural confidence needed for everything that follows.
The universe has been sending these messages for billions of years. The tools to read them have never been more accessible. Every clear night is an invitation to listen more carefully to what the light is actually saying.