Reading the Night Like Data: A Logbook That Tells You Which Nights Are Worth Staying Up For
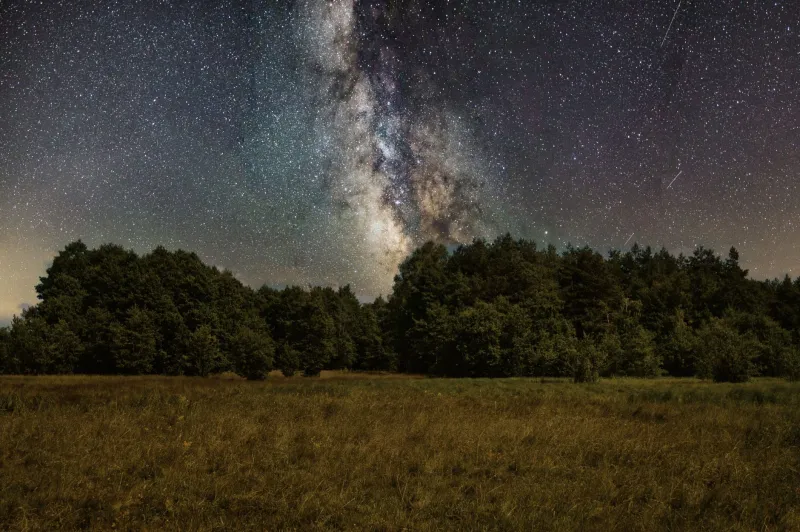
Bortle class is the most quoted number in amateur astronomy and one of the least useful on any given evening. It describes a location on a scale from pristine to inner-city. It does not describe tonight, and tonight is the only night you can photograph.
Two observers at the same Bortle 5 address will have wildly different results on consecutive Saturdays. The first enjoys a dry, stable air mass with a jet stream well to the north. The second fights a humid boundary layer, a 60-knot river of air overhead, and dew forming on the corrector plate by 10 p.m. One of them will produce a clean galaxy image. The other will spend the evening refocusing.
The remedy is not a better site. It is a better record.
What Bortle Actually Measures
Bortle class is a visual estimate of naked-eye limiting magnitude and sky glow, assigned once and usually inherited from a light-pollution map. It captures one variable — artificial sky brightness — at one scale. It cannot tell you how much water vapor sits in the column, how steady the air is, whether the transparency will hold past midnight, or how much of that glow will land in your red channel.
An SQM-L meter gives you a number instead of a category. Take three zenith readings at the start of every session, note them, and average. The spread between them is itself informative: a site that reads 20.1 one night and 19.4 the next has a transparency problem worth investigating.
The Columns That Matter
A useful log is short enough to fill in during twilight and specific enough to analyze later. Start with these.
| Field | Why it matters |
|---|---|
| Date, start/end time | Establishes your seasonal pattern |
| SQM-L, three readings | Measures actual sky brightness, not the map’s estimate |
| Ambient temp, dew point, RH | Dew-point spread under 5°F predicts dew and elevated sky background |
| Transparency (1–5) | Judged by naked-eye limiting magnitude or extinction near the horizon |
| Seeing (1–5 or Pickering) | Judged by a short star test; also note jet-stream speed at 200 mb |
| Wind, gusts | Predicting guiding errors and vibration |
| Moon illumination and separation | Determines which targets are viable |
| Target and filter | The variable you are trying to correlate |
| Median FWHM (arcsec) | The single best objective measure of seeing on your rig |
| Background level (ADU or e⁻/px) | Predicts sub length and total integration needed |
| Usable subs / total subs | The outcome metric that actually matters |
Fill in the top half at twilight and the bottom half the next morning. Ten minutes total.
The Two Variables People Confuse
Transparency and seeing are routinely conflated and behave in opposite directions. A hazy, humid night can be extraordinarily steady — the haze damps the small-scale turbulence that blurs stars — while passing very little light. That night is poor for a faint reflection nebula and excellent for lunar and planetary work, where the object is bright and the detail is high-contrast.
Conversely, a crystal-clear night following a cold front often delivers superb transparency with punishing seeing, because the same dry, unstable air mass that swept out the haze is still tumbling overhead. That is a night for broadband targets at shorter focal lengths, where FWHM matters less than sky clarity.
A jet-stream forecast at the 200 mb level is a serviceable proxy for seeing in most of the continental US. Sustained speeds above roughly 40 m/s are a reliable warning sign for the eastern two-thirds of the country. Below 25 m/s, the boundary layer — local terrain, roof lines, pavement — usually dominates instead.
Turning Thirty Sessions Into a Planning Tool
Nothing in the log pays off until you have a season of it. After roughly thirty sessions, sort your records by outcome and look for thresholds.
- Galaxies and reflection nebulae: require low background and good transparency. If SQM reads below your site’s median and dew-point spread is under 5°F, expect soft, noisy results regardless of integration time.
- Emission nebulae in narrowband: largely decoupled from sky brightness. These are the targets for the humid, moonlit, mediocre nights you would otherwise write off. Seeing still governs star size, but not the signal.
- Lunar and planetary: seeing-dominated. Ignore the SQM reading entirely and chase the jet-stream forecast.
- Wide-field Milky Way: transparency and moon phase dominate; FWHM is nearly irrelevant at 24 mm.
Once the thresholds are visible in your own data, the logbook becomes a filter. You stop asking whether tonight is clear — the weather app already told you that — and start asking which target tonight’s conditions actually favor.
Regional Reality Checks
The patterns differ enough across the US that generic advice underperforms a local record every time. Gulf Coast observers will find dew-point spread the single most predictive column in the table, with narrowband as the default summer strategy. Desert Southwest imagers should log the monsoon explicitly; July and August often deliver high cloud rather than rain, and transparency collapses in ways no Bortle figure anticipates. Great Lakes observers will see a seasonal swing in both seeing and transparency driven by lake temperature, and the pattern repeats closely enough year to year to be forecastable from a single season of notes.
The Discipline of Writing It Down
A log is only as good as the habit. Keep the template on the same laptop you use for capture, fill in the twilight fields before the sky is dark, and complete the morning fields before you go to work. The nightly effort is trivial. The accumulated value after two years is not.
You will find, eventually, that the most useful sentence in your entire observing practice is not “it was clear last night.” It is “it was clear, the SQM read 20.3, the jet was at 22 m/s, and I should have imaged the Veil.”